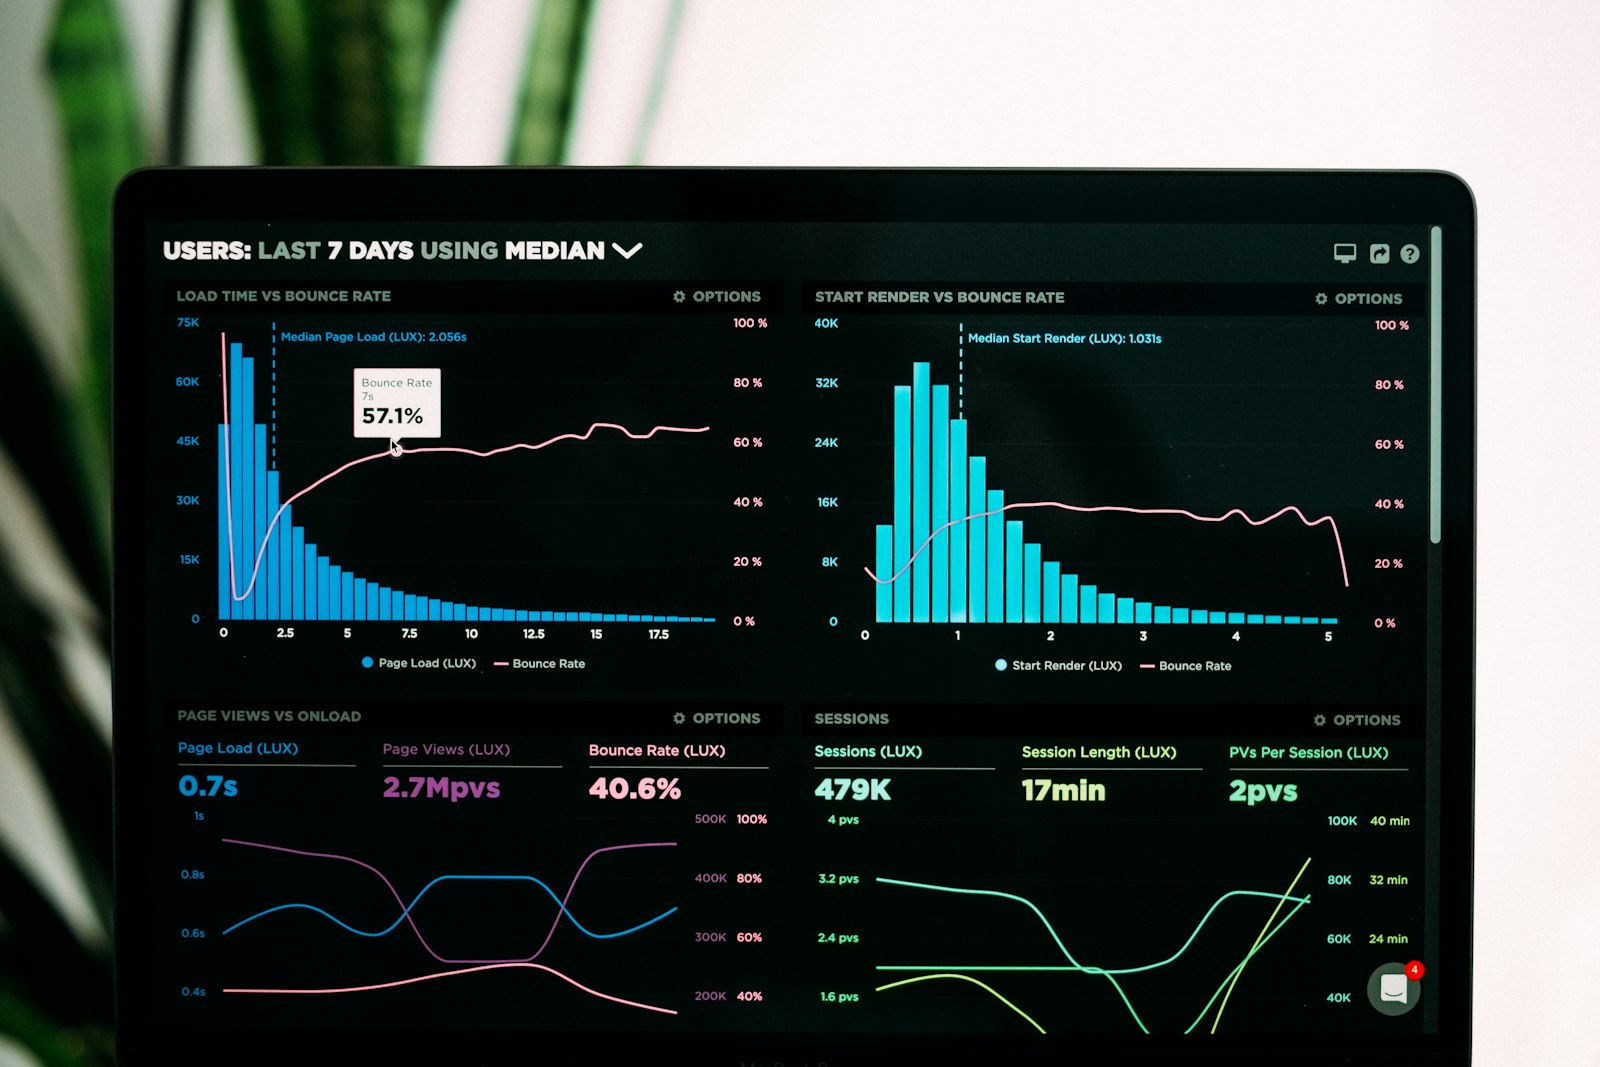
Monitoring tells you something is wrong; observability lets you ask why without shipping new code to find out. For a small team, the goal is not a wall of dashboards, it is answering three questions quickly at 2 a.m.: what broke, who is affected, and what changed.
Three signals, three jobs
- Logs record discrete events with context; they answer "what exactly happened in this request?"
- Metrics are cheap aggregates over time; they answer "is this normal?" and feed alerts.
- Traces follow one request across services and queries; they answer "where did the time go?"
Structured logs, JSON with consistent field names, are the highest-leverage upgrade available, because grep-able prose becomes queryable data. Attach a request ID at the edge and propagate it everywhere, so one slow checkout can be reconstructed end to end.
Alert on symptoms, not causes
Page a human when users are hurting: error rate above threshold, latency percentiles out of bound, queue depth growing without drain. CPU spikes and pod restarts are diagnostic detail, not alerts. Every alert should be actionable and rare, since a channel full of ignored warnings is operationally identical to no alerts, but with more guilt.
Start small and honest
An error tracker, uptime checks on your critical paths, structured logs in one searchable place, and the four golden signals (latency, traffic, errors, saturation) on one dashboard cover most of what a small product needs. Add distributed tracing when requests genuinely span services. After each incident, ask what question you could not answer quickly, and instrument that. Observability grows best as a response to real confusion, not as a procurement project.